Tools and Techniques to Debug an Embedded Linux System
Process of debugging
- Understand the problem.
- Reproduce the problem.
- Identify the root cause.
- Apply the fix.
- Test it. If fixed, celebrate! If not, go back to step 1.
Types of problems in Software
We can classify them into 5 major categories
- Crash. - Fatal exceptions
- Lockup/Hang. - Race conditions, Deadlocks
- Logic/implementation. - Logical errors
- Resource leakage. - Memory leaks
- (Lack of) performance. - Program is not performing as expected.
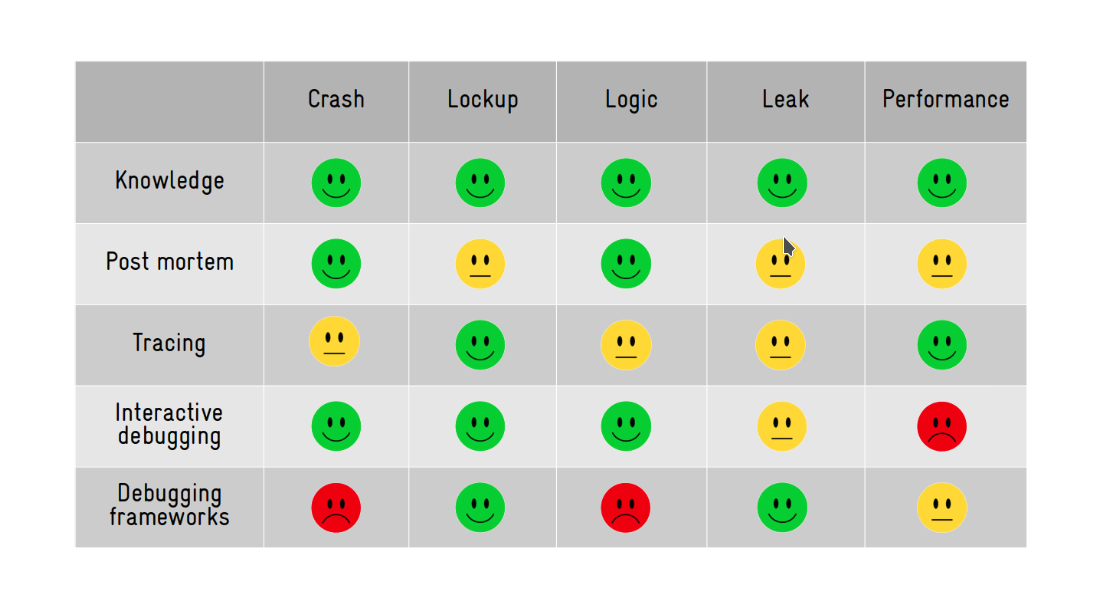
Tools & Techniques available for developers to solve these problems
- Our brain (aka knowledge).
- Post mortem analysis (logging analysis, memory dump analysis, etc).
- Tracing/profiling (specialized logging).
- Interactive debugging (eg: GDB).
- Debugging frameworks (eg: Valgrind).
Post mortem analysis
This type of analysis is done using the information exported by the system i.e logs, memory dumps etc.
For Kernel Crashes
Method1: addr2line
-
Get the address from the memory dump. address of the
pc(program counter) can be used to get the line where kernel crashed.[ 17.201436] PC is at storage_probe+0x60/0x1a0 [ 17.205810] LR is at storage_probe+0x48/0x1a0 [ 17.210175] pc : [<c06a21cc>] lr : [<c06a21b4>] psr: 60000013 -
You need the
vmlinuxfile which is in ELF format with debug infofile vmlinux vmlinux: ELF 32-bit LSB executable, ARM, EABI5 version 1 (SYSV), statically linked, BuildID[sha1] ca2de68ea4e39ca0f11e688a5e9ff0002a9b7733, with debug_info, not stripped -
Run the addr2line command with these inputs
addr2line -f -p -e vmlinux 0xc06a21ccThis will give you the line number where the kernel crashed.
for eg:
storage_probe at /opt/labs/ex/linux/drivers/usb/storage/usb.c:1118
Method2: gdb list
-
Get the function name + offset from the memory dump.
[ 17.201436] PC is at storage_probe+0x60/0x1a0 [ 17.205810] LR is at storage_probe+0x48/0x1a0 [ 17.210175] pc : [<c06a21cc>] lr : [<c06a21b4>] psr: 60000013i.e
storage_probe+0x60 -
You need the
vmlinuxfile which is in ELF format with debug infofile vmlinux vmlinux: ELF 32-bit LSB executable, ARM, EABI5 version 1 (SYSV), statically linked, BuildID[sha1] ca2de68ea4e39ca0f11e688a5e9ff0002a9b7733, with debug_info, not stripped -
Run gdb on the vmlinux file, inside gdb run the command
(gdb) list *(storage_probe+0x60)This will show you the line where the kernel crashed.
For Userspace Crashes
Use the core dump from the segfault to find the line at which the segfault occurred.
-
Set the system limits to unlimited
# ulimit -c unlimited -
Run the program untill it crashes, the crash will generate a file called
corewhich contains the core dump. -
Run the gdb on the core file and the program with debug symbols
gdb <program-here> -c core -
In gdb run the command
listto go to the line where the program crashed.pto print the specific variables.
Tracing
Tracing is a special form of logging, where data about the state and execution of a program (or the kernel) is collected and stored for runtime (or later) analysis.
Using print() or printk() statements to log the state and variables is also a form of tracing.
For kernel crashes
-
for kernel tracing we need to configure the kernel tracing options
zcat /proc/config.gz | grep TRACER=y CONFIG_NOP_TRACER=y CONFIG_HAVE_FUNCTION_TRACER=y CONFIG_HAVE_FUNCTION_GRAPH_TRACER=y CONFIG_CONTEXT_SWITCH_TRACER=y CONFIG_GENERIC_TRACER=y CONFIG_FUNCTION_TRACER=y CONFIG_FUNCTION_GRAPH_TRACER=y CONFIG_STACK_TRACER=y CONFIG_IRQSOFF_TRACER=y CONFIG_SCHED_TRACER=y CONFIG_HWLAT_TRACER=y CONFIG_OSNOISE_TRACER=y CONFIG_TIMERLAT_TRACER=y -
Mount the tracefs into the fs
mount -t tracefs tracefs /sys/kernel/tracing/ -
Record the traces of the function getting executed
trace-cmd record -p function_graph -F <module>/<sysfs trigger to a module> -
Generate the report of the tracing
trace-cmd report > trace.log -
Examine the trace.log to see the traces of the function.
Note: This is dynamic tracing i.e the tracing is enabled at runtime as long as the kernel is compiled with the correct configuration.
For userspace crashes
Method 1: strace
Using strace we can trace all the system calls the program is running to debug the program.
Run a userspace program with strace
# strace <program>
Method 2: Uprobe
This is used to trace the functions in the program.
-
Kernel needs to be configured with the below options
zcat /proc/config.gz | grep CONFIG_UPROBE CONFIG_UPROBES=y CONFIG_UPROBE_EVENTS=y -
Add the tracepoints to all the functions
# for f in `perf probe -F -x <program>`; \ do perf probe -q -x <program> $f; done -
List the tracepoints to know the tracepoint names
# perf probe -l | tee -
Run the application and capture the tracepoints.
# perf record -e <tracepoint_name>:* -aR -- <program> <args> -
Run the command to parse the trace
perf script | tee
Interactive Debugging
An interactive debugging tool allows us to interact with the application at runtime. It can execute the code step-by-step, set breakpoints, display information (variables, stack, etc), list function call history (backtrace), etc.
GDB is the go to tool for Interactive debugging.
For kernel space
Note: If running on embedded, you need a gdbserver running on the target device and a gdb client on the host device.
-
Enable KGDB in the kernel
# zcat /proc/config.gz | grep ^CONFIG_KGDB
CONFIG_KGDB=y
CONFIG_KGDB_HONOUR_BLOCKLIST=y
CONFIG_KGDB_SERIAL_CONSOLE=y
KGDB has registered serial console as the port for communication. But we can use kgdb/agent-proxy to forward text console over IP.
Details on how to connect can be found here - https://kernel.googlesource.com/pub/scm/utils/kernel/kgdb/agent-proxy/+/refs/heads/master/README.TXT
-
On target machine, Put the kernel in debugging mode
# Enable the serial port for kgdb communication # echo ttymxc0 > /sys/module/kgdboc/parameters/kgdboc # Put the kernel in debug mode # echo g > /proc/sysrq-trigger -
On host machine, run gdb with the kernel ELF
gdb vmlinux -tui-tuioption opens the TUI which shows the code and line number in gdb
-
In gdb prompt, run the command to connect to the target machine
(gdb) target remote localhost:5551 -
This will connect and open up the gdb for debugging, now you can set breakpoints get backtraces using gdb commands.
For userspace crashes
Note: If running on embedded, you need a gdbserver running on the target device and a gdb client on the host device.
-
Start the gdbserver, on target device
gdbserver :1234 <program> -
On the host device, run gdb with the program in ELF format
gdb <program> -tui -
In gdb prompt, connect to the target device
(gdb) target remote <IP>:1234 -
Now we can set breakpoints and see the backtrace of the program running on the target machine.
Debugging frameworks
Collection of tools when used to debug linux systems are called debugging frameworks.
Kernel has several debugging frameworks to identify memory leaks, lockups, etc (see the "Kernel Hacking" configuration menu)
In user space, there is Valgrind for debugging memory leaks, race conditions and profiling etc.
For kernel crashes
-
Enable the detections in the kernel configuration
# zcat /proc/config.gz | grep "CONFIG_SOFTLOCKUP_DETECTOR\|CONFIG_DETECT_HUNG_TASK" CONFIG_SOFTLOCKUP_DETECTOR=y CONFIG_DETECT_HUNG_TASK=y -
Once enabled, when something hangs for 30s or more, kernel will throw an oops.
-
After this we can use the steps in post mortem analysis to debug.
For userspace crashes
We use valgring to check for memory leaks, profiling , etc
For eg:
valgrind --leak-check=full <program>
This will check for leaks etc..
Which tool to use while debugging ?
This depends on what type of problem you are debugging.
References
Ref: https://www.youtube.com/watch?v=Paf-1I7ZUTo